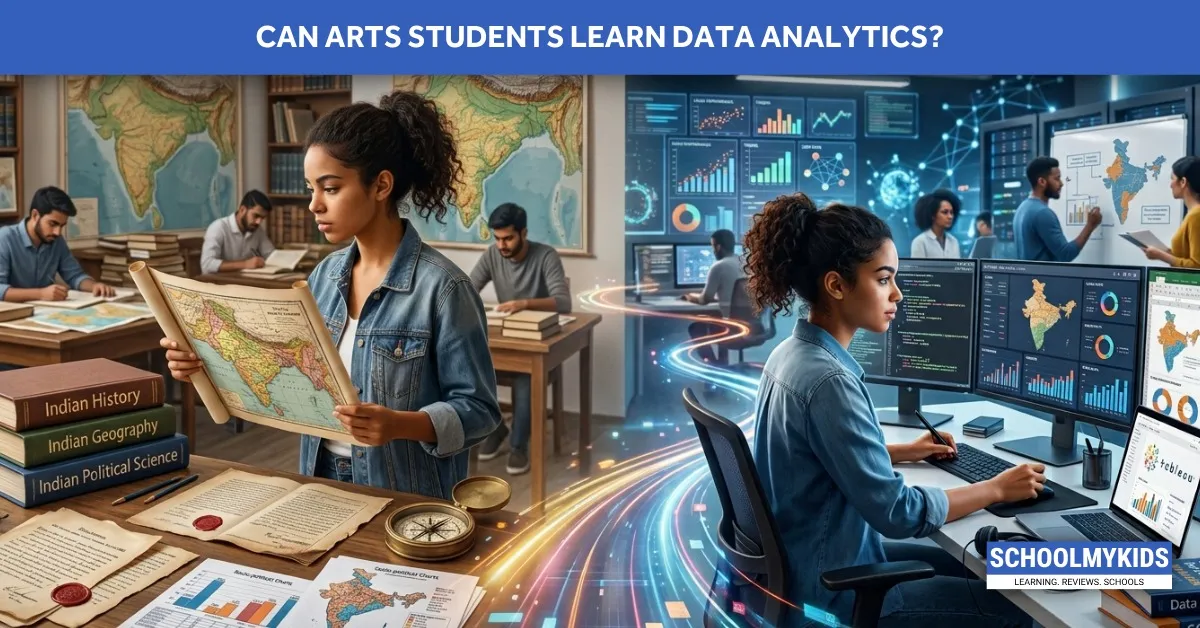
You’re an arts student. Maybe second year. Maybe you just finished college. You see job postings for data analytics. Decent salary. Seems interesting.
But then you think: “I didn’t study math in Class 11 and 12. I studied history. Can I even do this?”
Every career counselor will tell you: “Yes, you can learn anything.”
That’s technically true. But it’s not helpful. Because learning data analytics when you’re an arts student is different from learning it when you’re a science student.
It’s not impossible. But it’s a different path. It has specific challenges. And specific solutions.
It is time to be honest about both.
The Actual Challenge - Not Just “You’re Bad At Math”
Most arts students didn’t study math beyond Class 10. If they did take math in Class 11-12, it was often not rigorous. Not the same depth as the science stream.
This creates a specific gap: you haven’t practiced mathematical thinking in years.
Data analytics requires mathematical thinking. Not necessarily complex algebra. Not calculus. But thinking about numbers, patterns, relationships.
When you see a dataset with 10,000 rows, you need to think: “What patterns exist here? How do I find them?” That’s mathematical thinking.
For a science student, this is muscle memory. They’ve been doing this for years.
For an arts student, it’s new. Not impossible. Just new.
There’s another gap: you’ve probably never written code. Arts curriculum doesn’t include programming. So when you see SQL or Python for the first time, it feels foreign.
Again, not impossible. Just a different starting point.
The third gap: you probably don’t think in statistical terms. You’re used to reading stories, analyzing text, understanding context. That’s very different from looking at numbers and finding what they mean.
What Arts Students Actually Have As Advantage: This Part Nobody Mentions
Arts students have specific strengths data analytics actually needs.
You’re good at communication. Data analysts spend half their time communicating findings to non-technical people. Scientists are terrible at this. Arts students excel at explaining complex things clearly. (This is widely noted in hiring feedback from analytics teams. Communication and storytelling skills are repeatedly listed as the biggest gap among pure-tech hires.)
You understand context. You’ve studied history, politics, sociology. You understand why things happen. When you look at data, you naturally ask “why?” not just “what?” This is actually a data analyst skill. (Domain knowledge and the ability to ask “why” are frequently cited by hiring managers as differentiators for non-STEM candidates entering analytics.)
You’re comfortable with ambiguity. Math has right and wrong answers. Data is messier. You need to interpret. Arts students are trained for this.
You can write well. Writing clear reports is a data analyst responsibility. Scientists often can’t do this. You can.
You’ve probably done research projects. Essays. Papers. You know how to find sources, verify information, and present arguments. That’s essentially what data analysis is.
So yes, you’re missing some technical skills. But you’re not starting from zero. You’re starting with different skills.
The Specific Path For Arts Students
Month 1-2: Learn Excel Properly
Not basic Excel. Proper Excel.
Most people don’t know Excel. They think they do. They know how to put numbers in cells.
Real Excel: pivot tables, VLOOKUP, conditional formatting, data validation, charts that mean something.
Start here because Excel is less intimidating than coding. Also, you’ll use Excel constantly in data analytics.
Specific resource: LinkedIn Learning has good Excel courses. YouTube channels like Alex the Analyst have Excel tutorials specifically for data analysts.
Practice by taking messy datasets and cleaning them. Get comfortable manipulating data in Excel.
Time investment: 20-30 hours.
Month 2-3: Statistics Basics (The Right Way)
This is where arts students struggle most. “Statistics” sounds scary.
But you don’t need to know all of statistics. You need to know:
What is mean, median, mode (basic descriptions)
What is standard deviation (how spread out is the data)
What is correlation (do two things move together)
What is normal distribution (does data follow a bell curve)
What is hypothesis testing (is this difference real or random)
This covers the core descriptive and inferential statistics that most day-to-day data analyst work actually uses.
Learn through context, not theory. Not “here’s the formula.” But “here’s a dataset, here’s what we want to know, here’s how statistics helps us know it.”
This matters because your brain learns differently. Science students learn formulas first. You should learn problems first, then the statistics that solve them.
Specific approach: Start with the Khan Academy statistics course. But don’t watch passively. Find actual datasets on Kaggle. Try applying what you learned.
Time investment: 30-40 hours.
Month 3-4: SQL (The Gentle Introduction)
SQL is how you pull data from databases. It looks like a weird language.
SELECT * FROM sales WHERE date > '2026-01-01'
It’s actually English disguised as code.
For arts students, the barrier isn’t understanding logic. It’s not being intimidated by syntax.
Learn SQL through doing. Start with simple queries. Get data. See results. Build confidence.
Don’t memorize syntax. Use references. Real data analysts do this too.
Specific resource: Mode Analytics SQL tutorial or the free SQLBolt interactive lessons. W3Schools for quick reference.
Time investment: 20-25 hours.
Month 5: Pick A Tool (Tableau Or Power BI)
This is visualization. Taking data and making it visual.
Arts students are actually good at this. You understand storytelling through visuals.
Tableau or Power BI are industry tools. Pick one.
Tableau is more visual-first. Power BI is Microsoft, so it's integrated with Excel.
For arts students, Power BI might feel more familiar because it works with Excel.
Learn by building dashboards from real datasets.
Time investment: 15-20 hours.
Many arts students also complete the Google Data Analytics Certificate on Coursera (free to audit) alongside the tools above. It gives a clear structure and a shareable credential.
Month 6 Onwards: Python (Only If You Want)
Python is coding. This is optional for a data analyst role (though increasingly expected).
You can get your first job without Python. But learning Python makes you more valuable.
Arts students often skip this and regret it later. So include it.
Start with Python for data analysis specifically. Not general programming.
Learn: pandas (for data manipulation), matplotlib (for charts), basic data cleaning.
Specific resource: DataCamp has Python for data analytics courses. Jose Portilla’s Python for data analysis on Udemy is also good.
Time investment: 30-40 hours over 2-3 months.
The Actual First Job Search
After learning these skills, how do you actually get hired?
You may not be able to get a job at Microsoft or Google as a first job. But you can get a job at:
Smaller tech companies (data analyst roles)
Startups (they hire based on skills, not credentials)
Consulting firms (they have lots of analyst roles)
Analytics agencies (they need people for client work)
In India, salary for a first data analyst job: ₹3.5–6 lakhs per year typically (up to ₹7 lakhs at product companies and startups with a strong portfolio).
Build a portfolio before applying. Do 3-4 projects on Kaggle. Or analyze datasets from your interests. Put it on GitHub. Link from your resume.
Many first offers for arts graduates come through referrals or smaller analytics teams that explicitly value communication over pure technical pedigree.
When you apply, mention your arts background. Frame it as advantage, not liability.
“I bring communication skills and domain understanding to data work. My background in [history/literature/sociology] helps me ask the right questions about data.”
Companies increasingly value this. They have enough technologists. They lack communicators.
The Specific Fear: Math Anxiety (How To Actually Overcome It)
Arts students often have math anxiety from school. Bad experiences. Teachers who made them feel dumb.
The truth is that data analytics math is not the same as school math.
School math was about memorizing and applying formulas.
Analytics math is about understanding what a number means. “This data point is 3 standard deviations away. What does that tell us?”
It’s closer to your thinking style than you realize.
The way to overcome anxiety: work with numbers constantly. Not worrying about doing it “right.” Just getting comfortable.
Take a dataset. Look at numbers. Ask questions. Explore. No right or wrong answers at first.
Familiarity kills anxiety.
Common Mistakes Arts Students Make
Skipping Excel and jumping straight to Python.
Collecting certificates without finishing 3–4 real projects.
Hiding the arts background instead of framing it as a communication advantage.
Applying only to big tech companies for the first role.
Stopping at tools and never building conceptual understanding of statistics.
The Second Year Problem
Many arts students learn data analytics. Get first job. Then hit a wall around year 2.
Why? Because they never learned the math rigorously. They can do basic analysis. But when they need to do something new, they get stuck.
So while you’re learning the job-ready skills, also spend time on conceptual understanding.
Not memorizing formulas. But understanding what they mean.
This takes longer. But prevents hitting a wall later.
Real Situation: What Actually Happens
Shreya studied history. Felt lost after graduation. Learned Excel, SQL, Tableau in 4 months. Got a job at a startup as a junior analyst. Makes ₹4 lakhs.
After 6 months, asked to build a predictive model. Didn’t know how. Felt panic.
Should have learned Python and statistics more seriously during the initial learning phase.
Now she’s studying on the job. Stressful.
Better approach: learn everything up front. Take 6 months instead of 4. Be more prepared.
(Composite of common first-year experiences reported by arts-background analysts on LinkedIn and in placement forums, 2025–2026.)
Key Takeaways
Arts background doesn’t prevent a data analytics career
You’ll have a different learning path than science students
Math anxiety is manageable with the right approach
Your communication skills are an actual advantage
Learn in specific order: Excel → Statistics → SQL → Visualization → Python
Build portfolio before job search
First job pays ₹3.5–6 lakhs typically
Learn conceptual understanding, not just tools
FAQs
Q1: Do I need to learn Python to become a data analyst?
No, not for a first job. Many analyst roles need only Excel, SQL, and visualization tools. But learning Python later makes you more valuable and opens senior roles. Most analysts eventually learn it. So include it in your plan, but don’t let it block you from getting your first job.
Q2: I’m bad at math. Can I still do this?
Yes. A data analyst role needs mathematical thinking, not advanced math. You won’t use calculus or complex algebra. You’ll use basic statistics and logic. If you can understand cause-and-effect relationships, you can learn this.
Q3: How long does it actually take to get hired?
Learning core skills takes 4-6 months if you’re serious. Building a portfolio and searching for a job takes 1-3 months. So realistically, 5-9 months from start to first job. This assumes you’re studying consistently, not casually.
Q4: Should I do a bootcamp or online course or degree?
Bootcamp (3-6 months): Fastest path. Practical skills. But expensive (₹1.5-3 lakhs). Online course (2-4 months): Cheaper but self-paced. Harder to stay motivated. Degree (2 years): Most expensive. But gives a credential and deeper learning. For arts students, a bootcamp or online course makes more sense than a degree.







Be the first one to comment on this story.